
Figure 5.
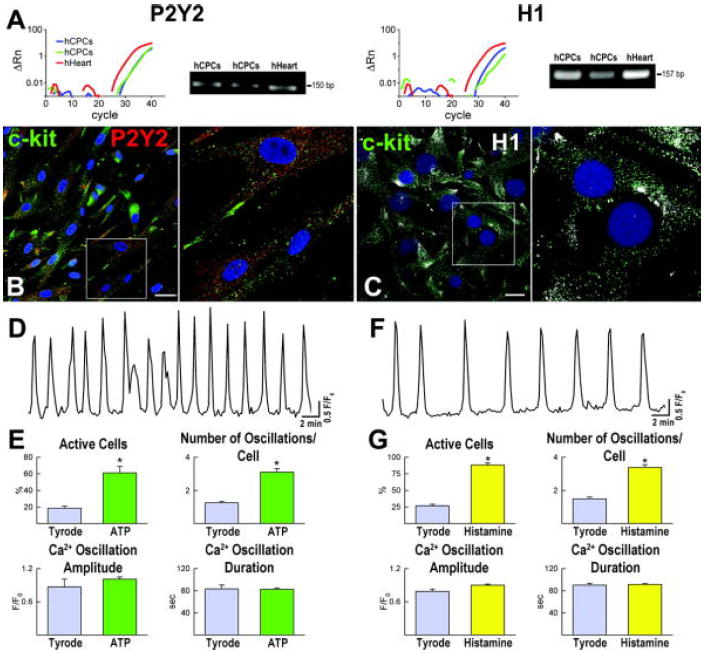
Gq-protein coupled receptors and intracellular Ca2+ in hCPCs. A-C, Expression at the mRNA (A) and protein (B and C) levels of P2Y2 and H1 receptors in hCPCs. Human heart (hHeart) was used as positive control. Scale bars: 10 μm. D-G, Ca2+ oscillations in hCPCs in the presence of ATP (D and E) or histamine (F and G). *P<0.05 vs. Tyrode.