Figure 6.

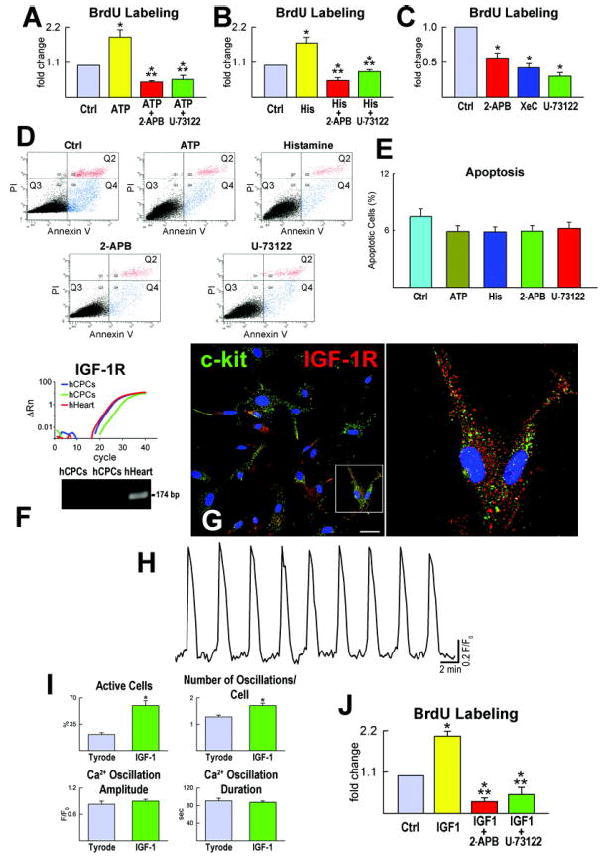
hCPC growth and apoptosis. A-C, ATP and histamine increase Ca2+ oscillations and proliferation of hCPCs. Inhibitors of Ca2+ oscillations prevent the effects of ATP and histamine. Control, Ctrl; histamine, His. *P<0.05 vs. Ctrl, **P<0.05 vs. agonist. D and E, Apoptosis of hCPCs measured by Annexin V labeling and FACS. PI, propidium iodide. Q2, late apoptotic or necrotic cells; Q3, alive cells; Q4, cells undergoing apoptosis. F and G, IGF-1R transcript and protein in hCPCs and hHeart. Scale bar: 20 μm. Right panel in G illustrates selected cells at higher magnification. H and I, Intracellular Ca2+ in hCPCs exposed to IGF-1. *P<0.05 vs. Tyrode. J, Proliferation of hCPCs in the presence of IGF-1 alone or in combination with inhibitors of Ca2+ oscillations. *P<0.05 vs. Ctrl, ** P<0.05 vs. IGF-1.
