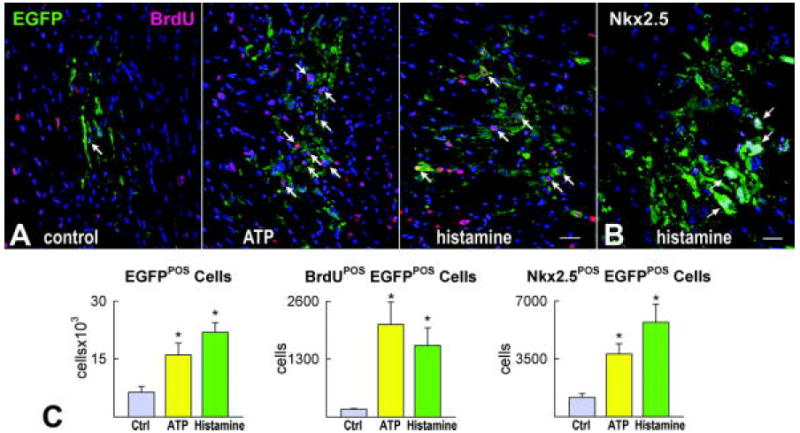
Figure 7.

Ca2+ oscillations and growth of hCPCs in vivo. A, EGFP-positive hCPCs 48 hours after implantation in the infarcted mouse heart under control conditions and following activation of hCPCs with ATP or histamine. Proliferation of EGFP-positive cells (green) is documented by BrdU labeling (magenta, arrows). B, Nkx2.5 (white) is present in several EGFP-positive cells (arrows). Scale bars: 20 μm. C, Results are shown as mean±SEM. *P<0.05 vs. Ctrl.
