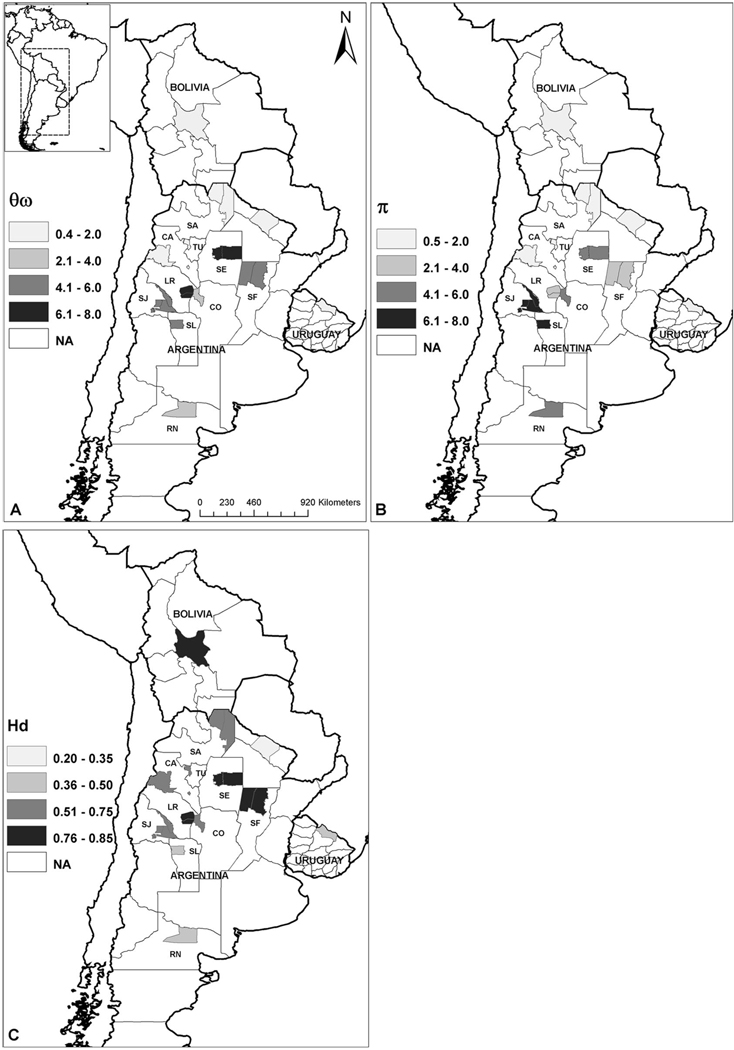
Fig. 1.
Geographical distribution of COI variability in Argentinean, Uruguayan, and Bolivian domestic and peridomestic T. infestans populations. (A) θw, Watterson’s estimator multiplied by 10−3. (B) π, Tajima’s estimator multiplied by 10−3. (C) Hd, haplotype diversity. Shaded areas in the map are the departments where the bugs were collected. Colors correspond to the four categories in which levels of variability were classified. NA, not available.

