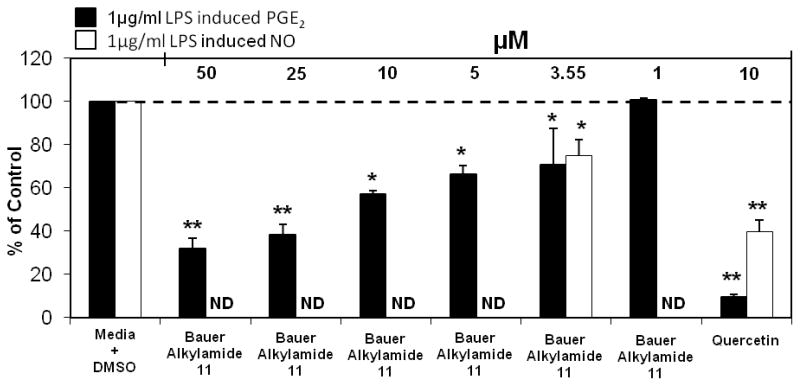
Figure 10.
Significant inhibition of LPS induced PGE2 and NO production in RAW264.7 cells after treatment with chemically synthesized Bauer Alkylamide 11. The black bars represent PGE2 levels and the white bars represent NO levels after induction with 1 μg/ml LPS and treatment with alkylamide (n = 3). All treatments + LPS were compared to media + DMSO + LPS control that was set at 100 % PGE2 production (4.7 ng/ml) and NO production (11.6 ng/ml). Treatments were also performed without LPS induction showing no significant differences in PGE2 or NO production. ND indicates analysis not determined. Quercetin was used as a positive control for both studies and showed significant inhibition of PGE2 and NO production at 10 μM (p<0.0001). * and ** are representative of p<0.05 and p<0.001. Each bar represents % of control ± standard error. Parallel cytotoxicity screens were conducted yielding no significant cytotoxicity with Bauer Alkylamide 11 at the concentrations screened (data not shown).

