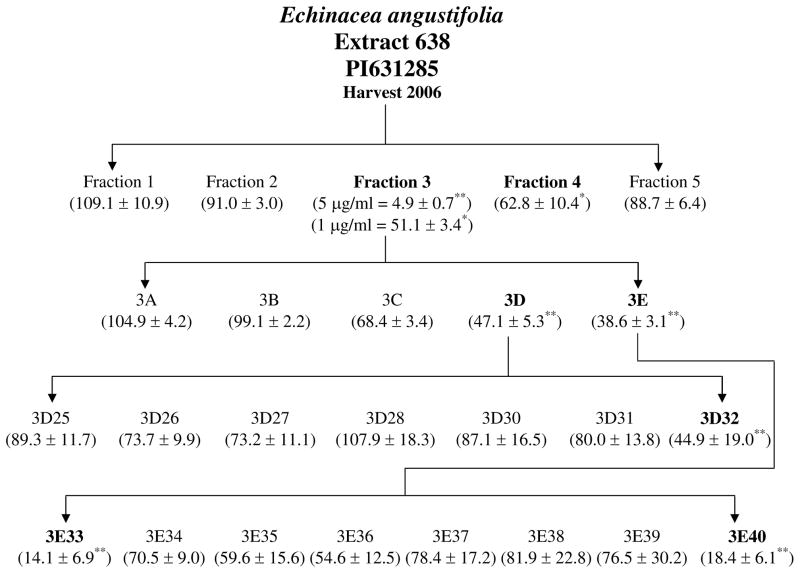
Figure 4.
Semi-preparative reverse phased HPLC fractionation scheme of E. angustifolia extract from 2006 harvest (PI631285). Bolded fractions represent those showing significant inhibition of LPS induced PGE2 production. Numbers in parenthesis indicate % of control ± standard error of PGE2 production compared to the media + DMSO + LPS control set at 100% PGE2 production. * and ** are representative of p<0.05 and p<0.001. See figures 4–8 for details on PGE2 data including concentrations studied.

