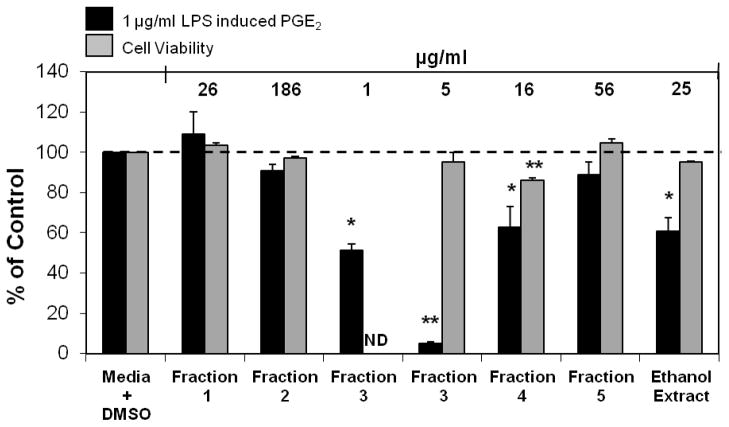
Figure 5.
Inhibition of LPS induced PGE2 production and cytotoxicity analysis after treatments with first round fractions from a 2006 extract of E. angustifolia (PI631285) in RAW264.7 cells. The black bars represent PGE2 levels after induction with 1 μg/ml LPS and treatment with an Echinacea fraction or ethanol extract (n = 3). All treatments + LPS were compared to media + DMSO + LPS control that was set at 100 % PGE2 production (2.2 ng/ml). Treatments were also performed without LPS induction showing significant reduction of PGE2 with fractions 1, 3, 4, and ethanol extract (p ≤ 0.035). The treatments without LPS were compared to the media + DMSO control set at 100 % PGE2 production (0.1 ng/ml). Grey bars symbolize cell survival compared to the media + DMSO control set at 100 % cell survival. Baicalein was used as the positive control in the PGE2 analysis and showed significant inhibition of PGE2 production (p<0.0001). ND indicates analysis not determined. Ursolic acid was used as a positive control in the cytotoxicity assay and showed significant cell death at 30 μM and 50 μM (p<0.0001). Media alone was also used as a negative control showing no significant inhibition of PGE2 or cytotoxicity. * and ** are representative of p<0.05 and p<0.001. Since Fraction 3 showed no cytotoxicity at 5 μg/ml it was not assessed for cytotoxicity at 1 μg/ml. Each bar represents % of control ± standard error.

