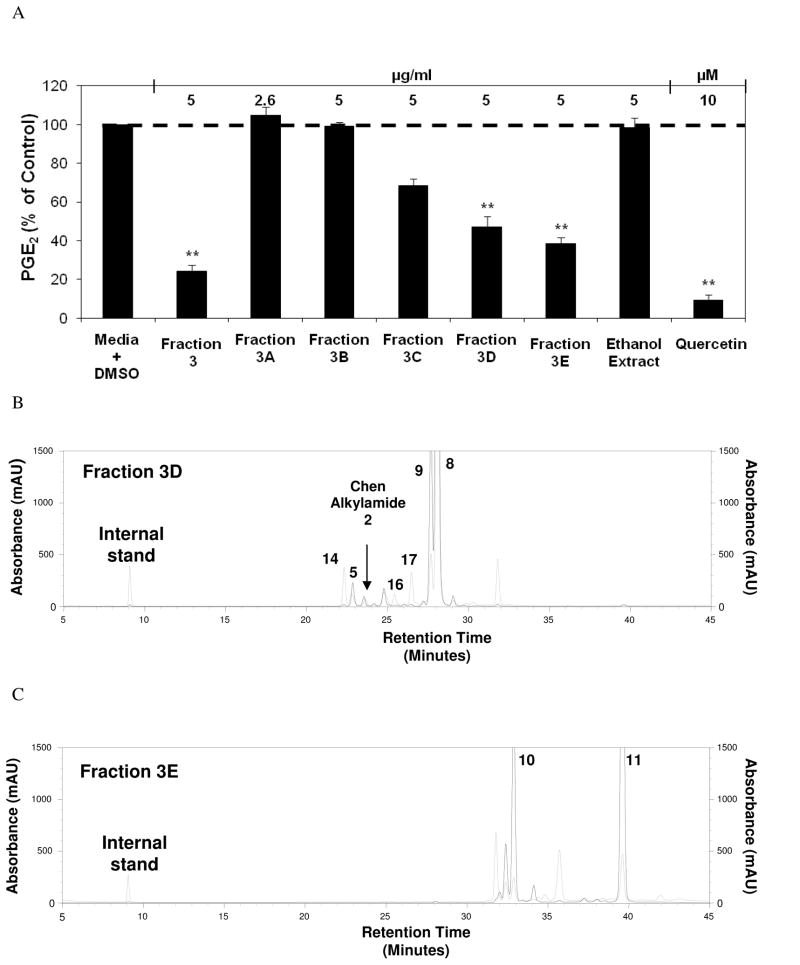
Figure 6.
(A) Inhibition of LPS induced PGE2 production in RAW264.7 cells after treatments with second round fractions from Fraction 3 of E. angustifolia (from figure 4). The bars represent PGE2 levels after induction with 1 μg/ml LPS and treatment with an Echinacea fraction or ethanol extract (n = 3). All treatments + LPS were compared to media + DMSO + LPS control that was set at 100 % PGE2 production (1.8 ng/ml). Treatments were also performed without LPS induction showing significant reduction of PGE2 with Fraction 3 and 3E (p ≤ 0.029). The treatments without LPS were compared to the media + DMSO control set at 100 % PGE2 production (0.1 ng/ml). Baicalein and quercetin were used as positive controls. Parallel cytoxicity screens were conducted yielding no significant cytotoxicity with any of the fractions (Data not shown). * and ** are representative of p<0.05 and p<0.001. Each bar represents % of control ± standard error. (B) HPLC chromatograms of second round Fractions 3D and (C) 3E, identifying key alkylamides (Quantification from HPLC present in Table 2). Black lines represent 260 nm and grey lines represent 330 nm. The internal standard used for both (B) and (C) was N-isobutylundeca-2-ene-8,10-diynamide (C15H21O2).

