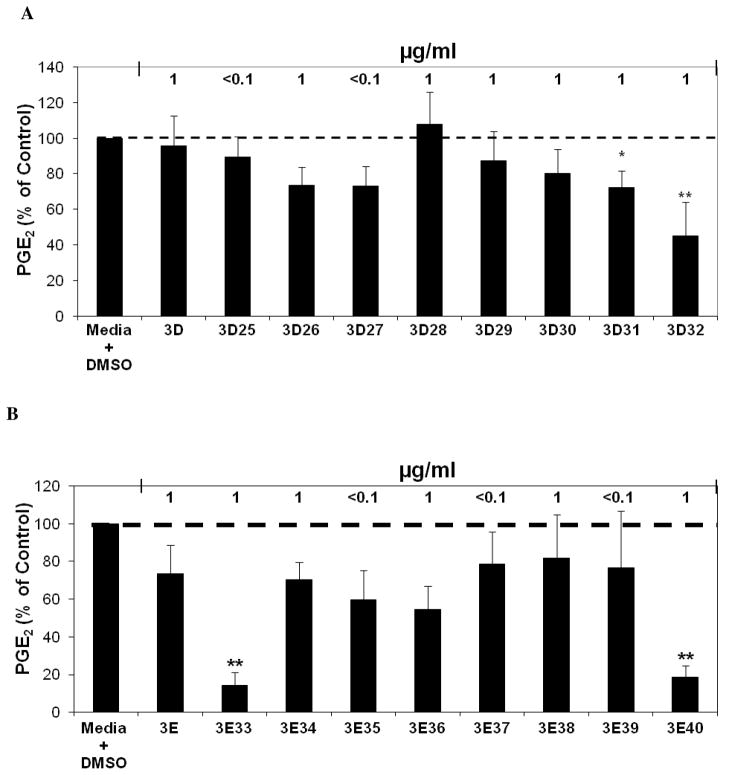
Figure 8.
(A) Inhibition of LPS induced PGE2 production analysis after treatments with E. angustifolia third round D fractions. The black bars represent PGE2 levels after induction with 1 μg/ml LPS and treatment with an Echinacea fraction or ethanol extract (n = 3). All treatments + LPS were compared to media + DMSO + LPS control that was set at 100 % PGE2 production (2.8 ng/ml). Treatments were also performed without LPS induction showing significant reduction of PGE2 with Fractions 3D, 3D26, 3D27, 3D30, and 3D31 (p ≤ 0.04). The treatments without LPS were compared to the media + DMSO control set at 100 % PGE2 production (0.2 ng/ml). Baicalein was used as a positive control (p<0.05). Parallel cytoxicity screens were conducted yielding no significant cytotoxicity with any of the third round fractions. * and ** are representative of p<0.05 and p<0.001. Each bar represents % of control ± standard error. (B) Inhibition of LPS induced PGE2 production after treatments with E. angustifolia third round E fractions. The black bars represent PGE2 levels after induction with 1 μg/ml LPS and treatment with an Echinacea fraction or ethanol extract (n = 3). All treatments + LPS were compared to media + DMSO + LPS control that was set at 100 % PGE2 production (1.9 ng/ml). Treatments were also performed without LPS induction showing significant reduction of PGE2 with fractions 3E, 3E33, 3E34, 3E36, 3E37, and 3E38 (p ≤0.027). The treatments without LPS were compared to the media + DMSO control set at 100 % PGE2 production (0.1 ng/ml). Baicalein was used as a positive control (p<0.05). Parallel cytoxicity screens were conducted yielding no significant cytotoxicity with any of the third round fractions. * and ** are representative of p<0.05 and p<0.001. Each bar represents % of control ± standard error.

