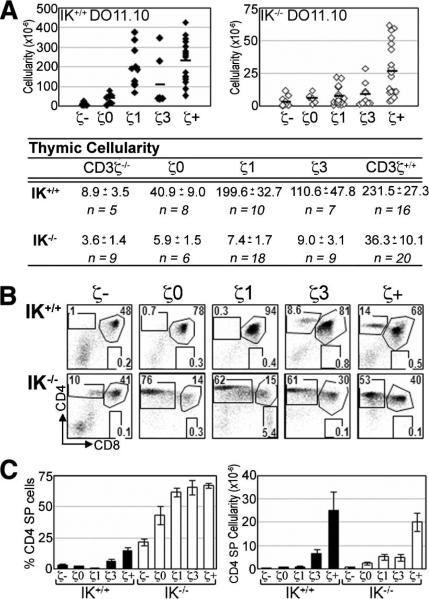
FIGURE 1.
IK–/– thymocytes expressing a DO11.10 TCR develop into CD4 SP cells with reduced TCR signaling potential. A, Absolute numbers of thymocytes in IK+/+ (filled symbols) and IK–/– (open symbols) DO11.10 ζTg mice. Averages, SEM, and sample size (n) are listed. B, Representative flow cytometry plots showing CD4/CD8 profiles of IK+/+ (upper panels) and IK–/– (lower panel) DO11.10 ζTg thymuses. Numbers denote percentage of cells in each region. C, Bar graphs denoting average percentage (left panel) and absolute number (right panel) of CD4 SP cells in IK+/+ and IK–/– DO11.10 ζTg thymuses. Error bars indicate SEM. ζ–, CD3ζ–/–; ζ+, CD3ζ+/+.

