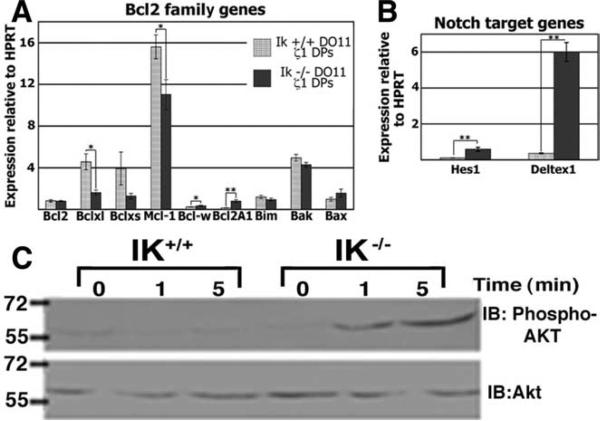
FIGURE 4.
Comparison of expression levels of Bcl2 family and Notch target genes and levels of Akt phosphorylation in the presence and absence of IK. A, Expression levels of Bcl2 family genes were analyzed by qRT-PCR in IK+/+ and IK–/– DO11.10 ζ1Tg DP thymocytes. Bar graph shows levels relative to those of HPRT. Bcl2, Bclxl, Mcl-1, Bcl-w, and Bcl2A1 are antiapoptotic, whereas Bim, Bclxs, Bak, and Bax are proapoptotic. B, Expression levels of Notch target genes Hes1 and Deltex1 were analyzed by qRT-PCR in IK+/+ and IK–/– DO11.10 ζ1Tg DP thymocytes. Bar graph shows levels relative to those of HPRT. All experiments were performed at least three times in duplicate. Error bars represent the SEM. p values were calculated using paired Student t tests. *, p < 0.1; **, p < 0.05. C, Akt phosphorylation levels were analyzed by Western blot analyses using protein extracts prepared from IK–/– and IK+/+ thymocytes activated by TCR cross-linking for the indicated amounts of time. Levels of Akt were analyzed as a loading control. IB, Immunoblotting.

