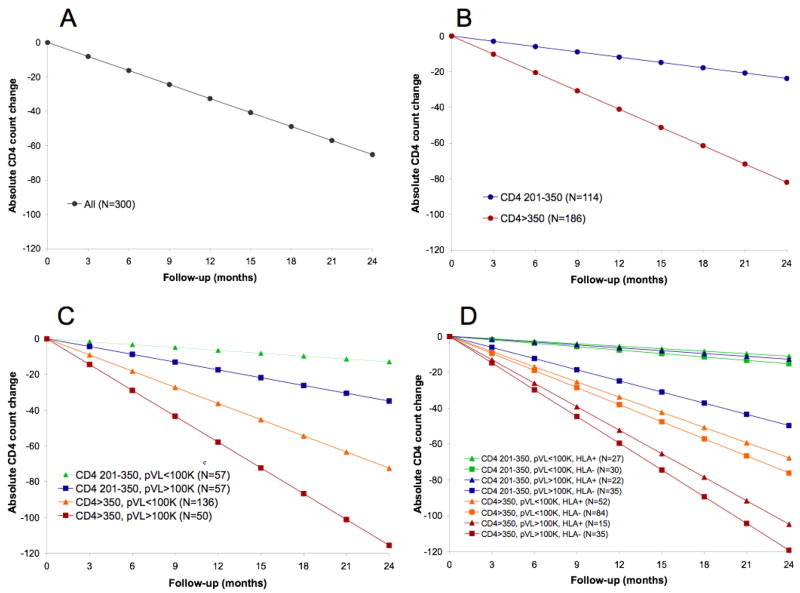
Figure. Absolute rates of CD4 decline, stratified by baseline CD4, plasma viral load and HLA class I alleles.
Results of multivariate, sequentially-built mixed effects models show mean rates of CD4 decline in the overall cohort (panel A); stratified by baseline CD4 count (panel B); stratified by baseline CD4 and pVL (panel C); and stratified by baseline CD4, pVL and the posession of a protective HLA allele (panel D). Individuals in different subgroups within the same stratum can be distinguished by the use of different shades of the same color; for example, individuals with baseline CD4 201–350 and >350 are represented by blue/green and red/orange lines, respectively, in figures C and D.

