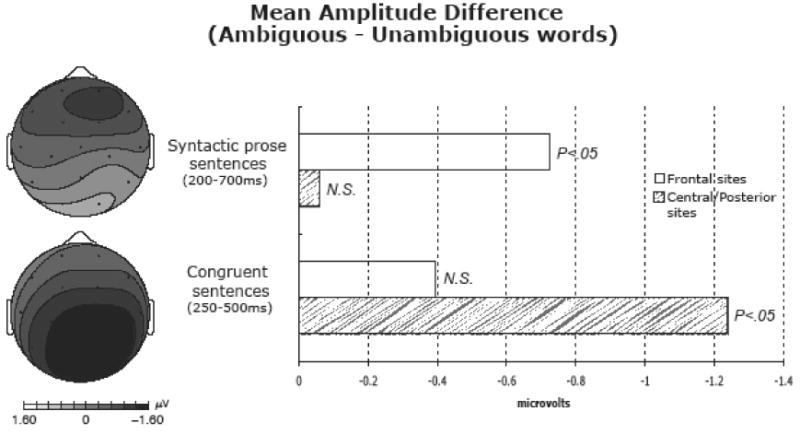
Figure 4.

Mean amplitude differences are summarized as isopotential voltage maps (on the left) and bar graphs (on the right) for the syntactic prose sentences (upper panel) and congruent sentences (lower panel) respectively. The two isopotential voltage maps show distributions viewed from the top of the head for (upper panel) the frontal negativity effect in the syntactic prose sentences in the 200-700 ms time window and (lower panel) the central/posterior N400 effect in the congruent sentences in the 250-500 ms time window. The right side of the figure plots the amplitude differences averaged over the 11 frontal sites and 11 central/posterior sites for the two sentence types. Longer bars indicate more negative brain responses to the ambiguous words than to the unambiguous words. The statistical significance of each difference is noted next to each bar (with N.S. = not significant).
