Figure 1.
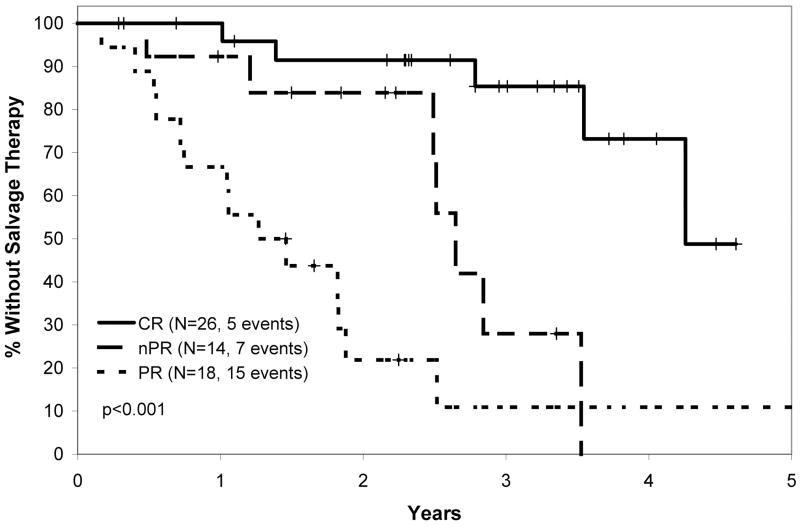
Figure 1A: Time to Salvage Therapy After PCR (pentostatin, cyclophosphamide, rituximab) Therapy.
Time from first date of PCR therapy to the date of next therapy based on response to PCR. Log rank p value shown.
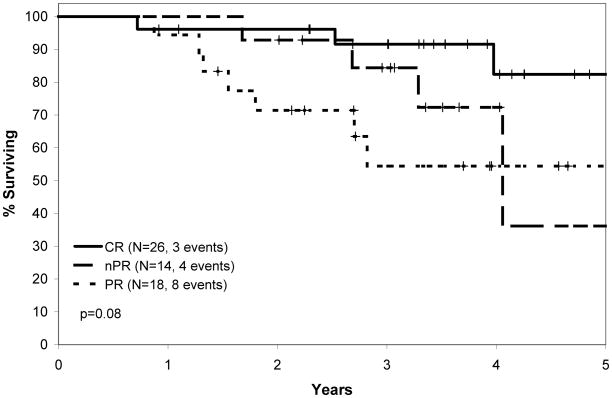
Figure 1B: Overall Survival After PCR Therapy.
Time from first date of PCR therapy to death based on response to PCR. Log rank p value shown.


