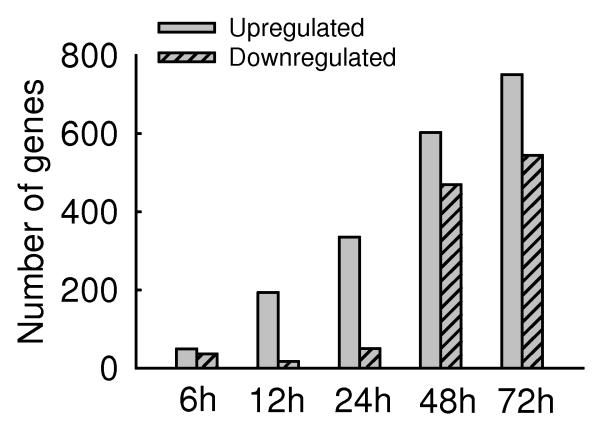
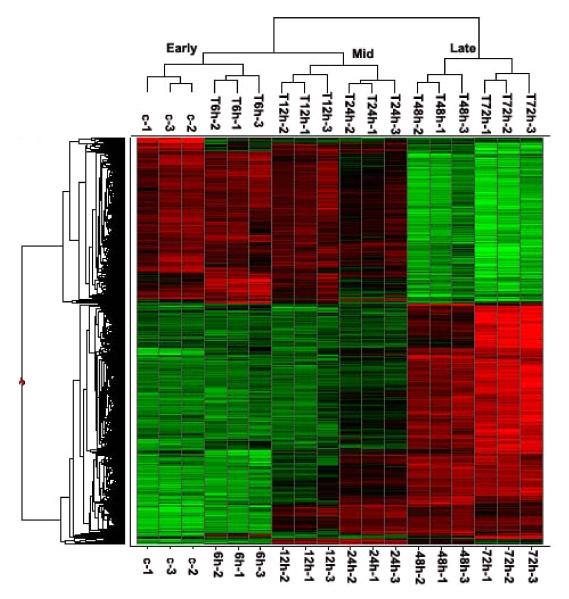
Fig.1. Host transcriptional responses induced by hMPV.
(A) Kinetics of changes in genes expression. Total RNA extracted from uninfected and hMPV-infected A549 cells were hybridized to the HG-U133 plus 2.0 GeneChip Arrays, as described in Methods. The genes, filtered as significant in response to hMPV infection at p-value<=0.05 and with a fold change of two or above, compared to baseline (uninfected), are represented at various time post-infection. Fold change is calculated on average expression values for each time point compared to the baseline. (B) Clustering and heat map analysis of hMPV-regulated genes. The expression pattern of genes significantly altered in response to hMPV infection is represented as a hierarchical clustering, using UPGMA (Unweighted Pair-Group Method with Arithmetic mean) with Euclidean distance measure. The heat map is an intensity plot which represents the clusters within the dataset. The column dendrogram represent the cluster within the time post hMPV infection and row dendrogram represent the genes clusters with similar pattern within and across time points. The red color represents the up-regulation and green the down-regulation of gene expression over time. Treatment conditions are indicated at the bottom of the figure: C represents the uninfected cells; 6 h, 12 h, 24 h, 48 h and 72 h indicate the time points of hMPV infection.


