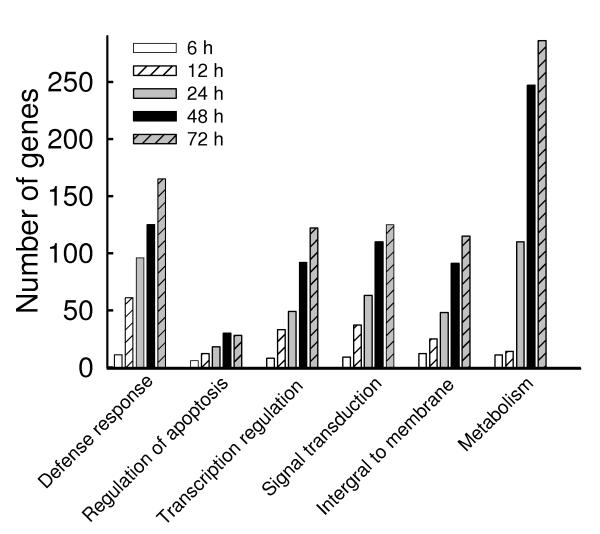
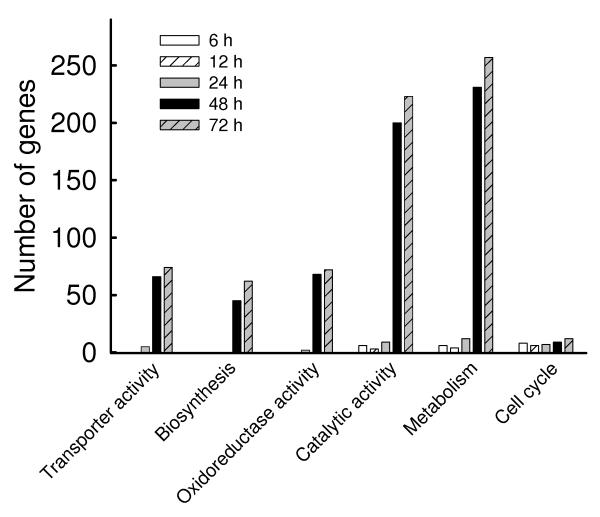
Fig.2. Gene ontology analysis of hMPV-induced transcriptional responses.
The genes filtered as significant in response to hMPV infection at p-value<=0.05 and with a fold change of two or above, compared to baseline (uninfected), were analyzed using the gene ontology tool available in http://david.abcc.ncifcrf.gov and grouped using medium classification stringency. The representative groups with enrichment score of 1.5 or above and P value of 0.01 or less are presented in_(A) for the up-regulated genes and in (B) for the down-regulated genes.


