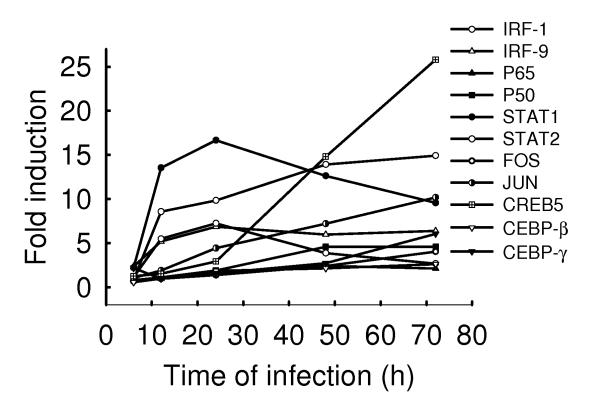
Fig.5. Induction of transcription factors after hMPV infection.
A549 cells were infected with hMPV at MOI of 1 for various length of time. Total RNA was extracted from control and infected cells and subjected to a microarray analysis, as described in Methods. Induction of transcription factor genes is plotted as a function of time. Fold change represents the ratio of gene expression level of infected versus uninfected cells at the different time points.

