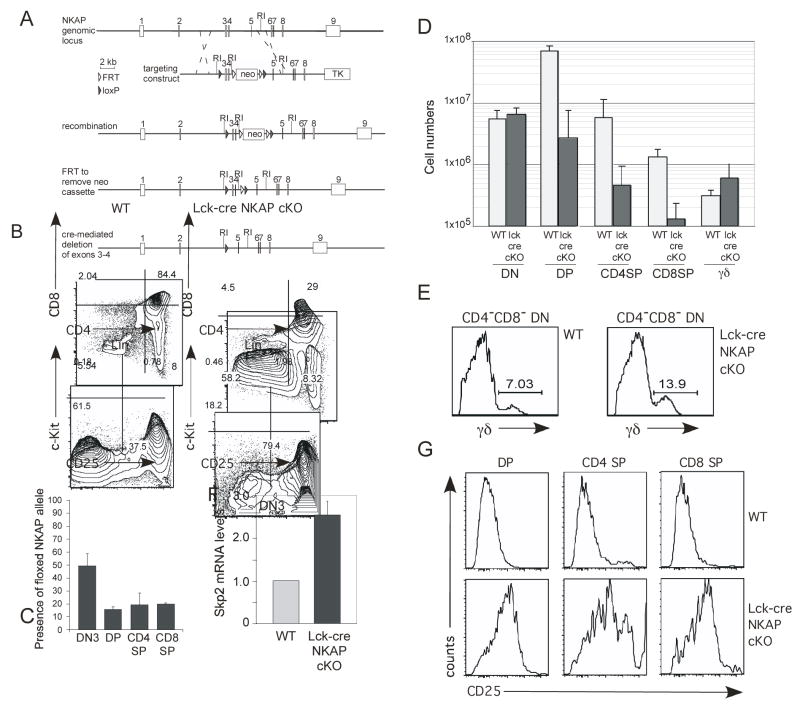
Figure 5. NKAP is required for T cell development.
(A) Schematic of the targeting construct used to generated floxed NKAP mice
(B, E) Thymocytes from lck-cre NKAP cKO and a wild-type control mouse was examined for T cell populations by flow cytometry as denoted in the figure.
(C) Genomic DNA from sorted wt and lck-cre NKAP cKO thymocyte populations were examined by Q-PCR for the presence of the floxed NKAP allele, using PCR primers which flank the upstream loxP site. Within each population, signal from lck-cre NKAP cKO populations were normalized to floxed, cre-negative wildtype populations. Error bars reflect SEM from triplicate samples.
(D) Absolute numbers of total DN, DP, CD4 SP, and CD8 SP cells from wild-type and lck-cre NKAP cKO mice were calculated. Results shown are the average absolute numbers, from between 3–5 lck-cre NKAP cKO and 3–5 wild-type mice, at 8–10 weeks of age. Error bars reflect SEM.
(F) DN3 thymocytes from wild-type and lck-cre NKAP cKO mice were isolated by FACS sorting. mRNA was generated and examined by Q-PCR for Skp2 mRNA expression, and normalized relative to wt Skp2 expression (=1). The data shown is from two wild-type and two cKO mice, each from independent sorts and independent Q-PCR. Error bars reflect SEM.
(G) Thymocyte populations from wild-type and cKO mice were analyzed for expression of CD25 as denoted in the figure.

