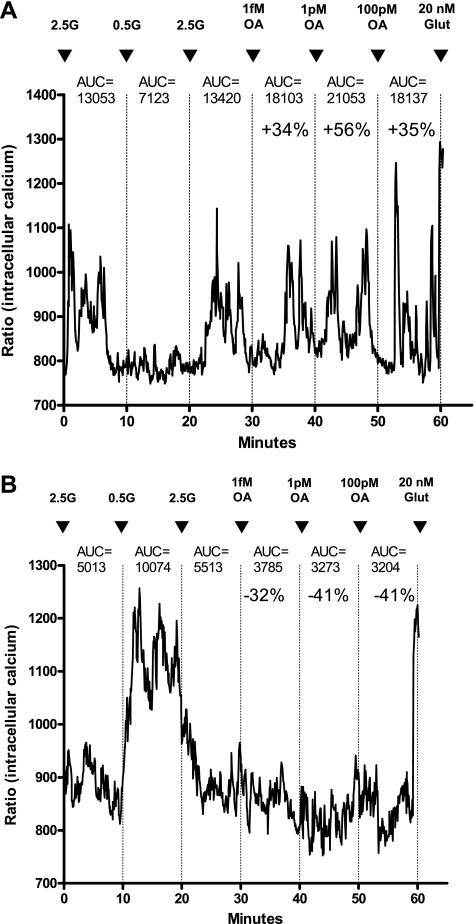
Fig. 1.
Representative changes in [Ca2+]i oscillations following exposure to incremental concentrations of oleic acid (OA) in freshly dissociated ventromedial hypothalamic nucleus (VMN) neurons from 3- to 4-wk-old male rats. The neurons were first characterized by their glucosensing category in response to altering glucose concentrations from 2.5 (2.5G) to 0.5 (0.5G) to 2.5 mmol/l (2.5G) followed by two or more concentrations of OA. Neurons were tested terminally with 20 nmol/l glutamate (Glut) to ascertain viability. A: Glucose-excited/OA excited neuron showing progressively increasing [Ca2+]i oscillations at 1 fM and 1 pM with a decrement at 100 pM OA; B: glucose-inhibited/OA-inhibited neuron showing decreasing [Ca2+]i oscillations at 1 fM to 1 pM with a plateau at 100 pM OA. Areas under the curve (AUC) for [Ca2+]i oscillation changes relative to the previous 10 min AUC values in response to changes in conditions are given over each 10-min segment of tracing.

