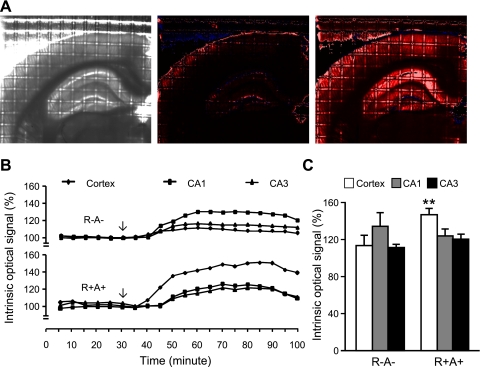
Fig. 2.
Enhanced swelling of brain slices from R+A+ mice after oxygen and glucose deprivation (OGD). A: representative images of 1 brain slice captured using a fixed-gain black and white video camera at baseline prior to OGD exposure (left), and images of the same brain slice normalized pixel by pixel to baseline captured at 0 min (middle) and at 30 min (right) after the start of OGD. Increases in intrinsic optical signal (IOS) intensity are indicated by color from black to red and then white. Blue color indicates decreases in intensity. B: representative IOS traces at 5-min intervals (average of the 5 data points from 1-min interval recordings) in cerebral cortex, and hippocampal CA1 and CA3 regions. The arrow indicates that OGD was started after 30 min of baseline recordings. C: The summarized IOS data after 30 min of OGD. Data are expressed as means ± SE. **P < 0.01, R+A+ vs. R−A−.

