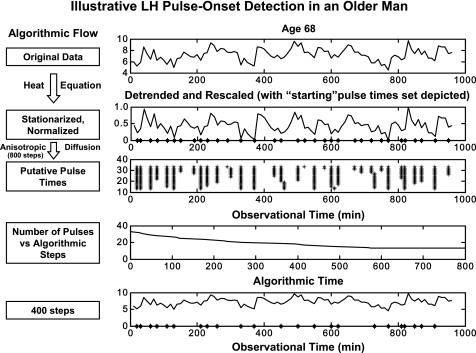
Fig. A1.
Candidate sets of LH pulse times (right) in a 68-yr-old man infused with saline. Top row: original 18-h LH concentration time series, during which data were obtained every 10 min. Second row: heat equation-detrended data rescaled to a uniform distribution on the interval [0,1]. * on x-axis denote all 32 initial local minima (potential pulse-onset times). Third row: remaining pulses after stepwise probabilistic dropout of the least contributory minima (*) across 800 iterations. Fourth row: algorithmic cycle-dependent (x-axis) estimates of LH pulse number (y-axis, per 24 h). Bottom 2 rows: locations of putative pulse onsets retained after 400 vs. 200 selective-smoothing operations (shown in relation to original LH series). Arrows identify the 4 pulse onsets removed between 200 and 400 iterations.

