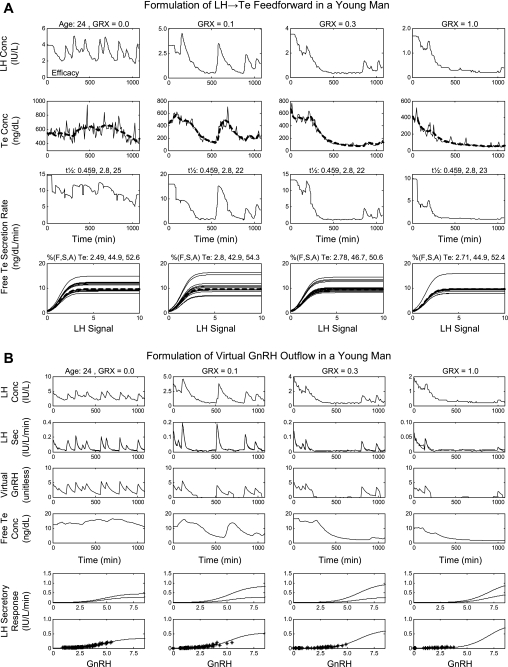
Fig. A3.
Reconstruction of LH → Te feedforward and estimation of GnRH → LH drive under Te repression using data from 0.0, 0.1, 0.3, and 1.0 mg/m2 GRX in a 24-yr-old man. A: reconstruction of LH → Te feedforward from the 4 GRX doses. Numerical half-life values given horizontally above each plot in the 3rd row are the fraction of total Te undergoing slow-phase elimination and the respective fast and slow half-lives (min). Numbers above each plot in the 4th row are percent free, SHBG-bound, and albumin-bound Te, respectively. B: estimation of GnRH → LH drive under Te repression using data from all 4 GRX doses. LH secretory response (bottom 2 rows) is the LH secretion rate driven by virtual GnRH outflow (unitless). *, LH secretion rates (y-axis). Bottom curve in each column is the mean GnRH → LH dose-response function, and the 2 curves in the penultimate row represent dose-response estimates at the lowest Te concentration (top curve) and the highest Te concentration (bottom curve) for that column and that GRX dose.

