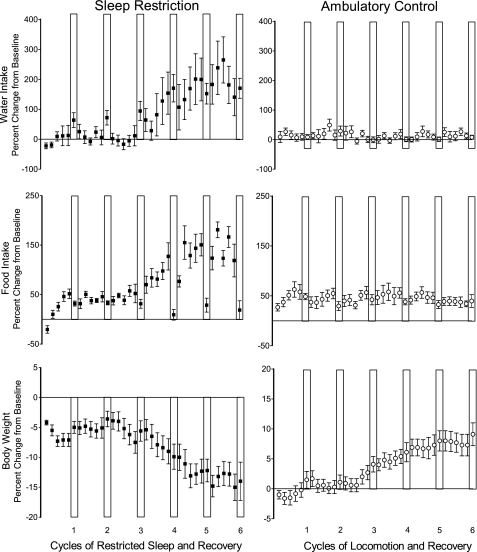
Fig. 3.
The effect of chronically inadequate sleep on water and food intake and body weight. Percent change from baseline daily values for water intake (top), food intake (middle), and body weight (bottom), across 6 cycles of sleep restriction and sleep recovery in sleep-restricted rats (■) and across 6 cycles of ambulation requirements and sleep recovery in ambulation-control rats (○). Recovery periods are indicated by the white vertical bars. Values are means (SE). n = 10 per group.

