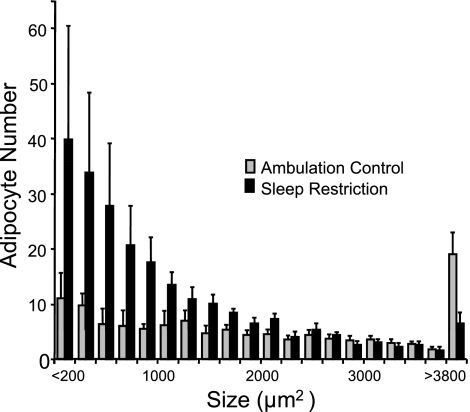
Fig. 4.
Representative frequency distribution of adipocyte size in chronically sleep-restricted and ambulation-control rats. Bars represent the number of adipocytes standardized to 0.5 mm2 of retroperitoneal adipose tissue, tallied in size intervals of 200 μm2, from ambulation control (n = 10) and sleep-restricted (n = 8) rats. Values are means ± SE.

