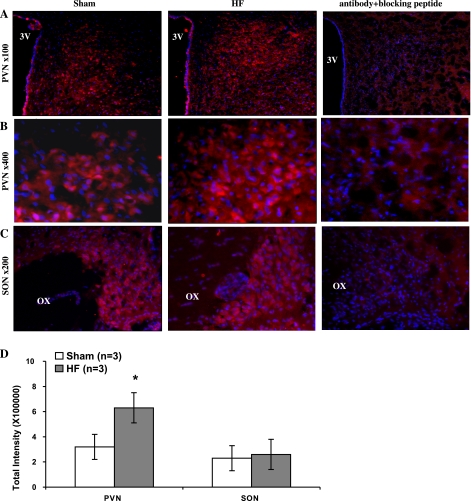
Fig. 7.
Immunofluorescent photomicrographs from the sections of the PVN (A and B) and SON (C) region stained for AT1 receptors with/without AT1 receptors blocking peptide. The intensity of AT1 receptor staining (red) is increased within the PVN in HF rats compared with sham rats. Blue spot shows the nucleus stained by Hoechst 33258. D: quantification data of immunofluorescence signal in the PVN and the SON. 3V, third ventricle; OX, optic tract. *P < 0.05 vs. sham group.

