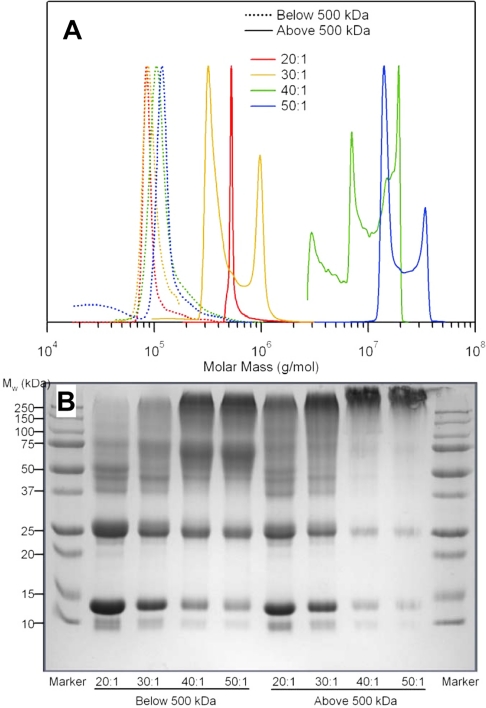
Fig. 1.
Molecular mass distribution (A) and SDS-PAGE (B) of low- and high-molecular-mass T-state polymerized bovine Hb (PolybHb) fractions. A: molecular mass distribution of low- and high-molecular-mass PolybHb fractions. Dotted lines represent PolybHb fractions <500 kDa in molecular mass; solid lines denote PolybHb fractions >500 kDa in molecular mass. B: SDS-PAGE of fractionated PolybHb solutions. The first and last lanes represent protein molecular mass markers, and eight sample lanes were loaded with PolybHb. The left lanes were loaded with PolybHb fractions <500 kDa in molecular mass, whereas the right lanes were loaded with PolybHb fractions >500 kDa in molecular mass. Cross-link densities ranged from 20:1 to 50:1.

