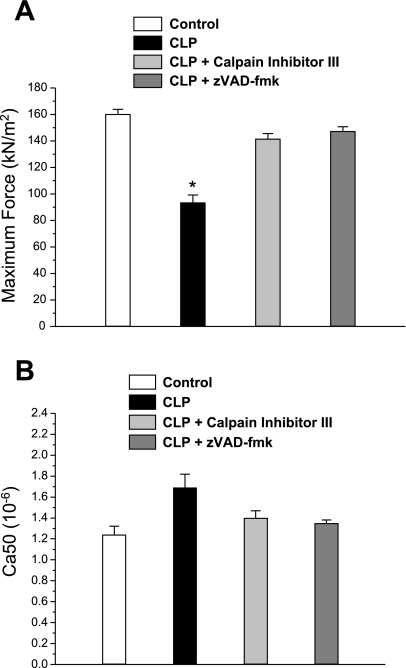
Fig. 5.
Parameters of skinned fiber force generation. A: maximum single-fiber force generation was reduced for fibers from CLP animals (solid bar) compared with force for fibers from control animals (open bar) (P < 0.001). Fibers from CLP animals given either CI III (light shaded bar) or zVAD-fmk (dark shaded bar) generated forces that were significantly higher than that observed for the CLP group (P < 0.001). B: Ca2+ concentration producing half-maximal activation (Ca50) for force-pCa curves of single fibers trended to higher levels for the CLP group (solid bar) compared with the control (open bar), CLP plus CI III (light shaded bar), and CLP plus zVAD-fmk (dark shaded bar) groups, but this difference did not reach statistical significance. *Significant statistical difference between CLP and the other groups, P < 0.05.

