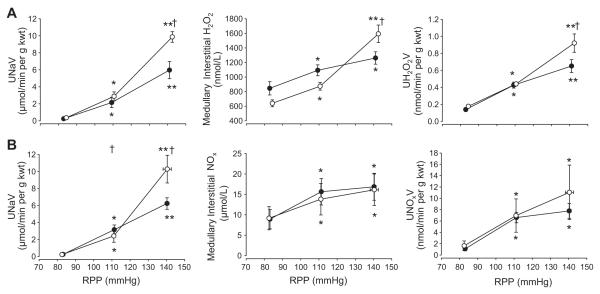
Figure 1.
Responses to changes in renal perfusion pressure (RPP) are shown in kidneys with intact capsules (open circles) and following decapsulation (closed circles). In Panel A, the changes in excretion of urinary sodium (UNaV; top figure), medullary interstitial H2O2 (middle figure), and urinary excretion of H2O2 (UH2O2V; bottom figure) following a change in RPP are shown. Panel B shows the change in excretion of urinary sodium (UNaV; top figure), medullary interstitial NOx (middle figure), and urinary excretion of NOx (UNOxV; bottom figure) following a change in RPP. Values are means ± SE. * indicates significant change from the lowest pressure (p<0.05); ** indicates significant change from both the lowest and the intermediate pressure (p<0.05); † indicates significant difference from the decapsulated group at the same pressure step (p<0.05).

