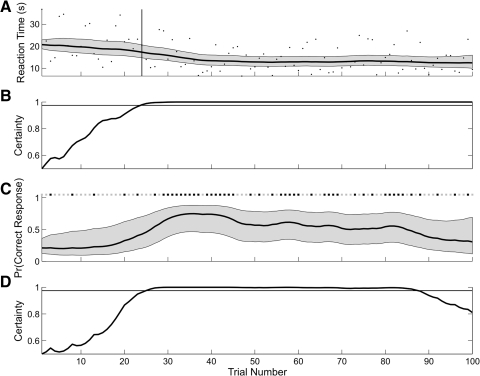
Fig. 1.
A: black dots are the reaction times from the simulated experiment. Expectation maximization (EM) algorithm estimates of the reaction-time curve (thick black curve) and its 95% confidence intervals (gray area) computed from the reaction-time data. The vertical line marks trial 24, the IO(0.975) learning trial based only on the reaction-time data. B: the ideal observer curve computed from the analysis of the reaction-time data only crosses 0.975 (horizontal line) at trial 24. The horizontal line is 0.975. C: the simulated correct (black squares) and incorrect (gray squares) trial responses (top). EM algorithm estimate of the learning curve (thick black curve) and its 95% confidence interval (gray area) based on only the binary data. D: ideal observer curve computed from the analysis of the binary data only. The horizontal line is 0.975. There is no IO(0.975) learning trial from the analysis of the binary data only because the ideal observer curve drops <0.975 at trial 88.

