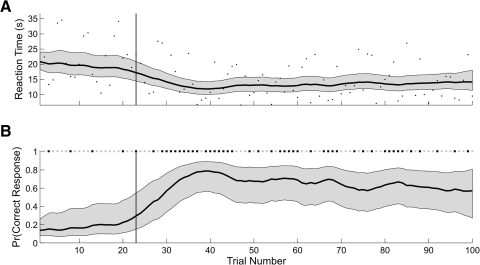
Fig. 2.
A: black dots are the reaction times from the simulated learning experiment. EM algorithm estimates of the reaction-time curve (black curve) and its 95% confidence intervals (gray area) computed from the combined analysis of the reaction-time and binary data. B: the simulated correct (black squares) and incorrect (gray squares) trial responses are shown at the top of this panel. EM algorithm estimate of the combined analysis learning curve (black curve) and its 95% confidence intervals (gray area). The vertical lines mark trial 23, the IO(0.975) learning trial.

