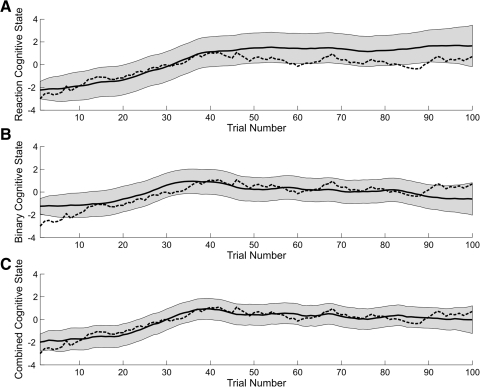
Fig. 3.
EM algorithm estimate of the cognitive state (solid black curve) and its 95% confidence interval (gray area) based on the reaction-time data only (A), the binary data only (B), and the combined reaction and binary data (C). The true cognitive state process is the dashed black curve in all panels.

