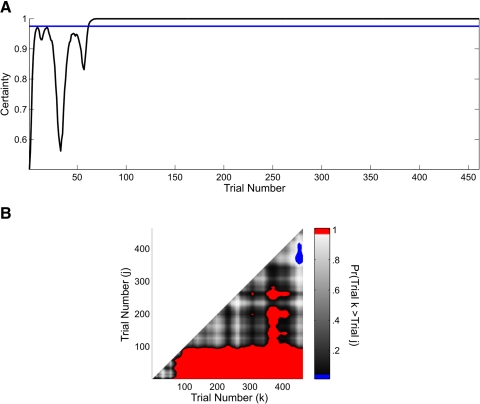
Fig. 6.
A: ideal observer curve computed from the combined analysis of the run time and binary data of the mouse executing the T-maze task (Fig. 5). The horizontal line is 0.975. B: trial-by-trial comparison of the probability that the cognitive state at trial k (x axis) is greater than the cognitive state at trial j (y axis) <k, where k = 2,…, 461 and j = 1,…, 460. Comparisons for which this probability is ≥0.95 are shown in red and comparisons for which this probability is ≤0.05 are shown in blue.

