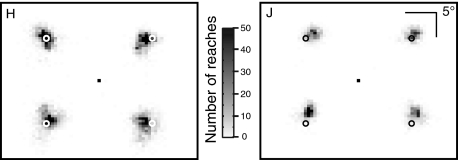
Fig. 1.
Spatial distribution of reach endpoints in the visual search task for the 2 monkeys. The 4 target locations are marked by white (left) or black (right) circles. The 30 × 30° space has been divided into 0.5 × 0.5° bins, with the darkness of each bin indicating the number of reach endpoints in that bin.

