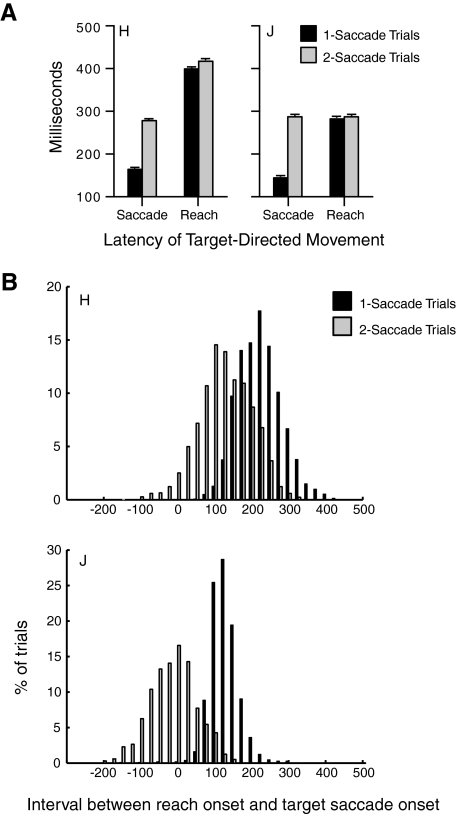
Fig. 6.
A: comparison of the mean latency for each monkey of saccades and reaches in 1- and 2-saccade trials. B: histograms show, for each monkey, the distribution of the interval between reach and saccade onset toward the target in 1-saccade (black) and 2-saccade (gray) trials. Positive numbers on the abscissa indicate trials in which the saccade to the target is initiated before the reach, and negative numbers indicate the opposite order.

