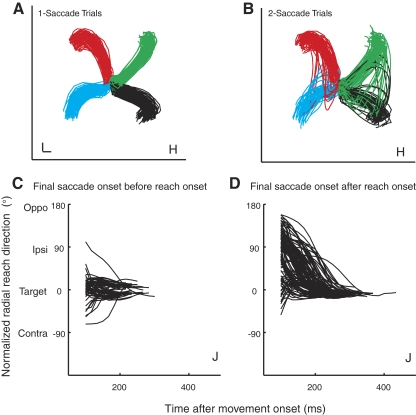
Fig. 8.
A and B: examples of reach trajectories in 1-saccade (A) and ipsi 2-saccade trials (B) for monkey H. These trajectories are tracked in 3 dimensions, but, for clarity, only the components in the plane of the touchscreen monitor are shown. Trajectories associated with each target location are plotted in a different color: green (45°), red (135°), blue (225°), and black (315°). The scale bar indicates 1 cm. C and D: plots of radial direction vs. time during the movement for monkey J in ipsi 2-saccade trials. Trials were categorized according to whether the saccade to the target began before reach onset (C) or after reach onset (D). In all cases, the eyes arrived at the target before completion of the reaching movement.

