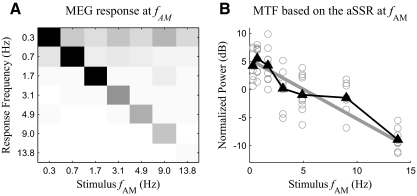
Fig. 4.
Analysis of the power of the aSSR at fAM. A: confusion matrix of the power of the MEG response at fAM. The diagonal elements of the confusion matrix are the power of aSSR at fAM, without any normalization or correction. The grayscale map is as shown in Fig. 3. B: the modulation transfer function (MTF) calculated as a function of the corrected power of the aSSR at fAM and stimulus fAM. Each gray hollow circle represents the corrected power of the aSSR at fAM for one subject. The black line marked by triangles shows the grand averaged MTF. The gray line is the optimal linear fit of the MTF.

