Fig. 2.
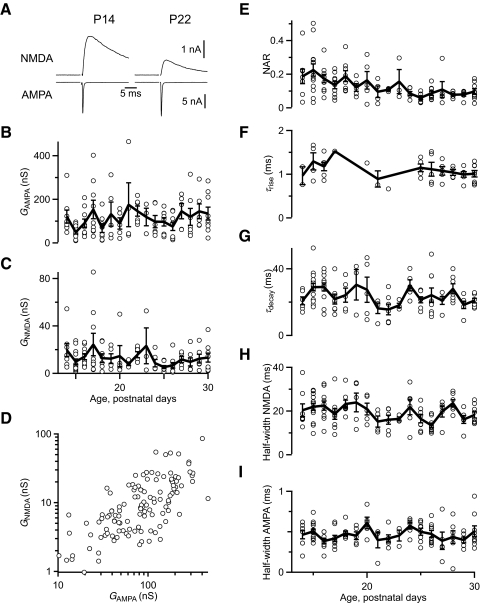
Development of glutamatergic currents in the endbulb of Held following single stimuli. A: example traces of NMDAR and AMPA receptor (AMPAR) currents in juvenile (P14) and older (P22) mice. AMPAR currents throughout were measured at –70 mV, and NMDAR currents at +40 mV. Some NMDAR currents were recorded in the presence of NBQX. Traces are averages of 5–8 trials. Horizontal scale applies to both AMPA and NMDA traces. B and C: absolute conductance of AMPAR (B) and NMDAR (C) currents over the age studied (n = 122 cells). D: correlation between NMDAR and AMPAR conductances (n = 122 cells). E: NMDAR conductance measured at +40 mV normalized to the AMPAR conductance measured at –70 mV for each cell as a function of age (n = 122). This value is referred to as the NMDAR/AMPAR ratio, or NAR. NAR reaches a plateau after ∼P18. F and G: kinetics of NMDAR currents over the ages studied, using single-exponential fits. For NMDAR currents measured in the presence of NBQX (n = 49 cells), it was possible to measure the rate of rise (F). The rate of decay was measured in 117 cells (G). These measures show no significant changes with age. H and I: AMPAR current half-width (H) and NMDAR current half-width (I) over the ages studied (n = 122 cells). AMPAR and NMDAR half-widths do not change. Bold lines in B–I are the average values for all recordings at each postnatal day.

