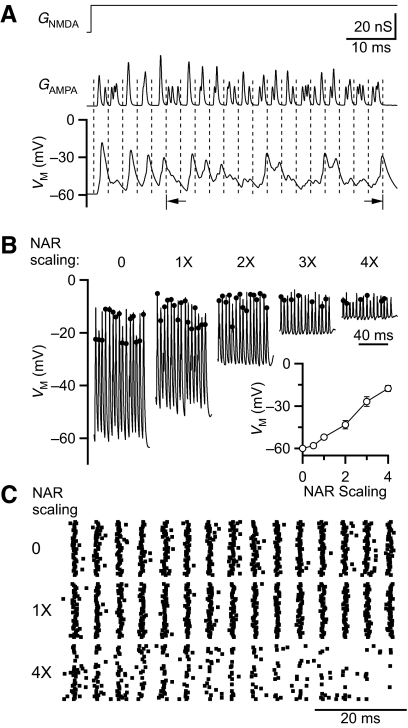
Fig. 6.
Using dynamic clamp to study the effects of NMDAR on interactions of multiple inputs. NMDAR conductance is simplified as a constant at the steady-state level. AMPAR peak conductance is the average steady-state level. Three inputs are mimicked at 200 Hz, with Gaussian-distributed jitter (0.5 ms SD). A: examples of applied NMDAR (top) and AMPAR (middle) conductances with the BC responses (bottom). The NAR is scaled to 1× (i.e., normal). Data for subsequent figures are grouped from cycles 6–20 (arrows). B: representative traces for NAR scaling at 0 to 4× normal. Dots mark spike times. At greater depolarization levels some excitatory postsynaptic potentials (EPSPs) do not give rise to spikes. Discrimination of spikes requires using the derivative and comparing against a passive model of the cell (for methodology, see Supplementary Fig. S2). Inset: average effects of NAR scaling on membrane potential during a train. Each point is the average of 4–11 recordings. C: representative spike raster of BC firing in response to NAR scaling 0, 1, and 4× (n = 20 of each).

