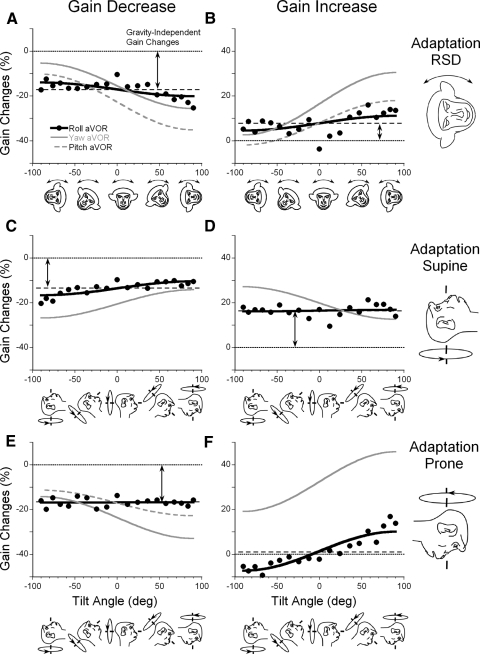
Fig. 5.
Decrease (A, C, and E) and increase (B, D, and F) of the torsional aVOR gain in side-down (A and B), supine (C and D), and prone (E and F) head orientations. Filled symbols represent data averaged for three animals. Data were fitted with a cosine (Eq. 1, black solid line) and compared with the fits made through the average changes obtained after yaw (gray solid line) and pitch (gray dashed line) aVOR adaptation in the same animals.

