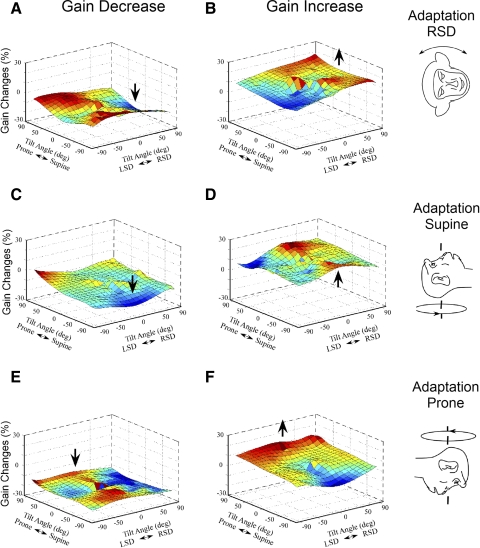
Fig. 6.
Three-dimensional surface of torsional aVOR gain changes obtained after the gain was decreased (A, C, and E) or increased (B, D, and F) in RSD (A and B), supine (C and D), and prone (E and F) head orientations. Maximal values are coded as a gradient of the red color, while minimal values are coded as a gradient of blue color.

