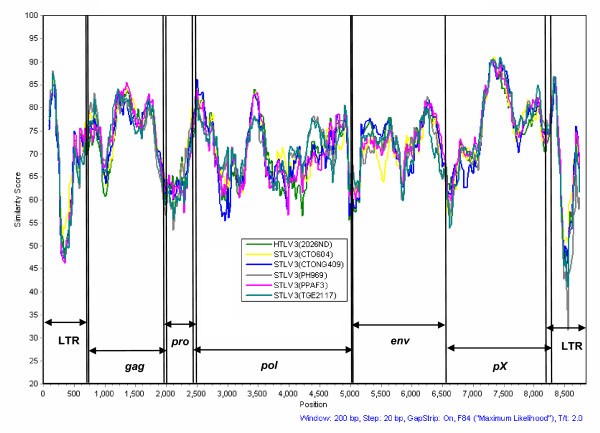
Figure 2.
Similarity plot analysis of the full-length STLV-3d(Cmo8699AB) and prototypical PTLV-3 genomes using a 200-bp window size in 20 step increments on gap-stripped sequences. The F84 (maximum likelihood) model was used with an estimated transition-to-transversion ratio of 2.28. HTLV-3b(Pyl43) was not included in the analysis because of its high identity (> 99%) to STLV-3b(CTO604) and because of a 366-bp deletion in the pX region of this virus [15].

