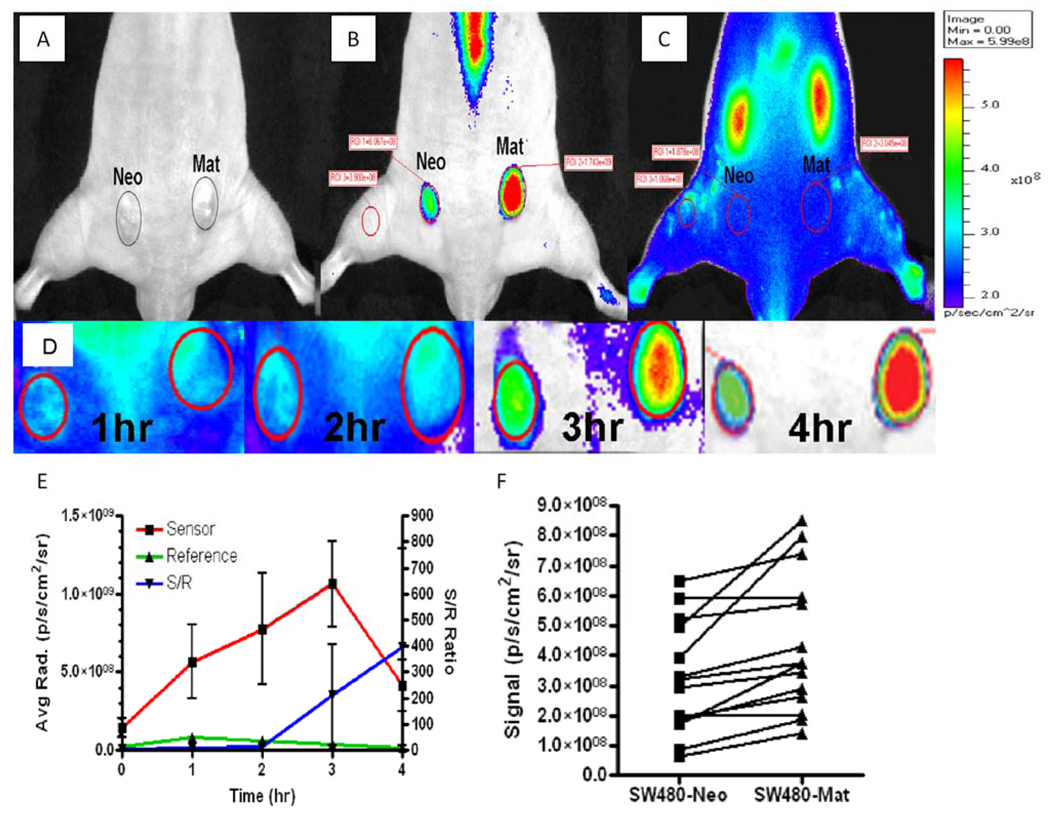
Figure 3. In vivo imaging of mouse subcutaneous xenograft tumors with PB-M7NIR.
Dorsal, caudal view of a nude mouse 4 weeks following subcutaneous injection of SW480neo (Neo) or SW480mat (Mat) cells. Tumor areas (approximately 57mm2 each) are shown in white light (A), the Cy5.5 Sensor channel (B), and the ICG Reference channels (C) 4 hr post retro-orbital intravenous injection of 1.0 nmole PB-M7NIR. Encircled areas represent regions of interest for quantitative assessment. Note accumulation of PB-M7NIR in the kidneys of the mouse as detected with the ICG reference channel (C), but selective accumulation of sensor signal in the Mat tumor indicative of proteolytic activity (B). Sensor signal on the spine and tail are presumed to be due to low levels of circulating, activated probe that become detectable when they are close to the surface of the mouse. (D) Higher magnification of the sensor signal images of the Neo and Mat tumors of the same mouse at 1, 2, 3, and 4h timepoints. (E) Sensor (red squares) and reference (green triangles) signals plotted over time in a mat tumor showing increased signal in the sensor channel starting at the 2 hr time point reaching a maxima at the 3–4 hr imaging point. S/R ratio (blue inverted triangles) increases with time. Mean and Standard Deviation, n=3 (F) Sensor signal in the SW480neo and SW480mat tumor for each individual mouse is indicated by the linked symbols (n=13).

