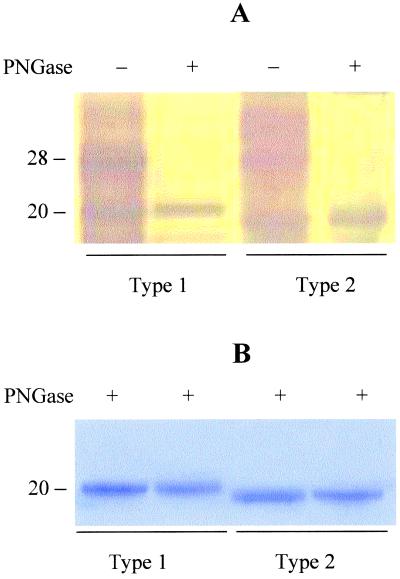
Figure 2.
Analysis of purified type 1 and type 2 PrPSc. (A) Silver staining of SDS/PAGE. (B) Coomassie blue staining of the sequencing membrane used for automated Edman degradation. Samples were either untreated (−) or treated (+) with PNGase F. Molecular size markers are shown in kilodaltons on the left.

