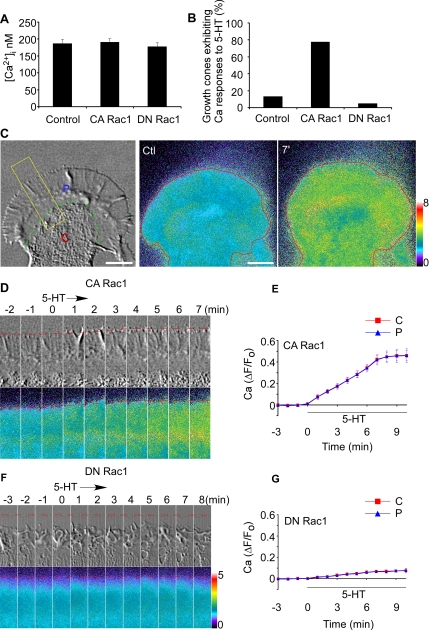
Figure 3.
5-HT evokes Ca2+ rise in CA Rac1 backgrounds. (A) Baseline Ca2+ level in growth cones in different Rac1 backgrounds. N = 6 (control), 6 (CA Rac1), or 5 (DN Rac1). Values are expressed as mean ± SEM. (B) Probability of 5-HT (10 μM)-evoked Ca2+ responses in growth cones in control, CA Rac1-, or DN Rac1-injected neurons. N = 15 (control), 18 (CA Rac1), or 20 (DN Rac1). (C) Left, DIC image of growth cone. C, central domain (C-domain); P, peripheral domain (P-domain). Green dashed line, interface between C- domain and P-domain defined by organelle boundary. Middle and right, Ca2+ ratio images of the entire growth cone before (ctl) and after 7 min in 5-HT (10 μM throughout). Red line, leading edge. Bar, 10 μm. (D and F) Time course of 5-HT (10 μM) effects. DIC (top) and Ca2+ ratio images (bottom) in CA Rac1- (D) or DN Rac1 (F)-injected neuron obtained from area of interest as indicated in C (left, yellow rectangle). Elapsed time (minutes) is shown at the top. Red dotted line, peripheral boundary. (E and G) Summary of ΔF/F0 plots recorded in the entire C-domain (red line) or P-domain (blue line) of growth cones quantifying Ca2+ response to 5-HT over time in CA Rac1 (E) or DN Rac1 (G) backgrounds. N = 5 (CA Rac1) or 4 (DN Rac1). Values are expressed as mean ± SEM. Black bar shows 5-HT presence. N denotes the number of growth cones tested. Ca2+ ratio image is coded by pseudocolors in linear scale (see bars).

