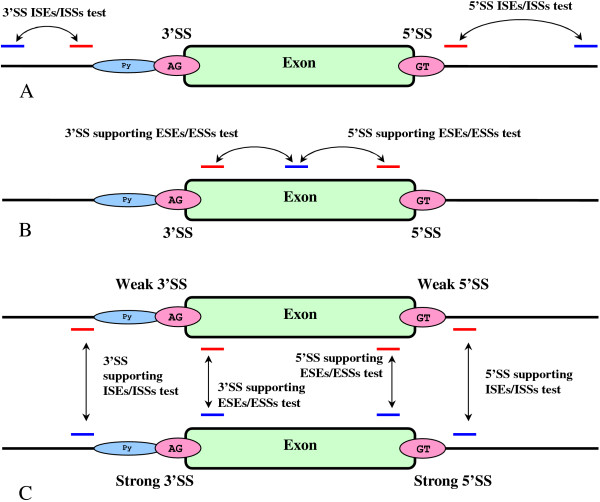
Figure 2.
Location of genomic regions used for comparative analysis. (A) Statistical significance tests for intronic enhancing/silencing elements surrounding exon. Blue is the null-hypothesis region and red is the region of statistical significance associated with the exon proximity. The red region is specifically located outside the area associated with donor or acceptor signal consensuses [36]. (B) Statistical significance test for the ESEs/ESSs elements supporting the exonic definition. This strategy allows canceling the statistical biases associated with the protein coding potential best characterized by the hexamer statistics [41] and focusing at the essential difference between the exonic flanks, normally enriched with ESEs [42], and the middle section supposedly depleted of such elements. (C) The differential strategy allows detecting enhancing and silencing elements that have substantially different concentration in vicinity of a strong vs. weak SS as defined by the Bayesian SS sensor [36]. The score from the sensor is measured on a discrete scale from 1 to 5, where 1 stands for a weak signal and 5 stands for strong.

