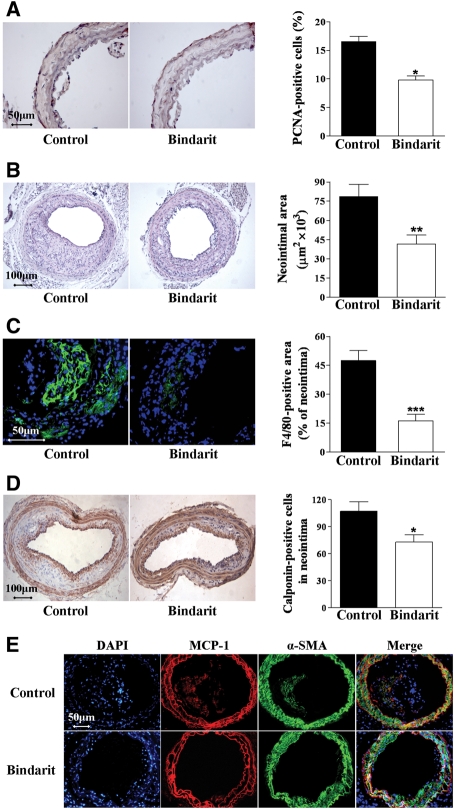
Figure 5.
(A) Photomicrographs showing the effect of bindarit (200 mg/kg/day) on PCNA-positive cells in apoE−/− mice 7 days after injury (magnification ×400). Results are expressed as mean ± SEM of the percentage of total PCNA-positive cells as described in Section 2, where n = 10 rats for each group. *P < 0.05 vs. control group. (B) Photomicrographs showing the effect of bindarit (200 mg/kg/day) on neointima formation in apoE−/− mice 28 days after carotid injury (magnification ×100). Results are expressed as mean ± SEM, where n = 10 for each group; **P < 0.01 vs. control group. (C) Photomicrographs showing the effect of bindarit (200 mg/kg/day) on macrophage content in carotid arteries 28 days after injury (magnification ×400). Results are expressed as mean ± SEM of the percentage of F4/80 immunostained area per total neointima area, where n = 10 for each group; ***P < 0.001 vs. control group. (D) Photomicrographs showing the effect of bindarit (200 mg/kg/day) on neointimal VSMCs content in carotid arteries 28 days after injury (magnification ×100). Results are expressed as mean ± SEM of the calponin-immunostained cell number, where n = 10 for each group; *P < 0.05 vs. control group. (E) Immunofluorescence visualization of α-SMA (green) and MCP-1 (red) in mouse carotid arteries 28 days after injury. DAPI (blue) was used to locate nuclei. Co-localization of MCP-1 and α-actin (yellow) was evident in some cells in both media and neointima (magnification ×200).

