Figure 4.
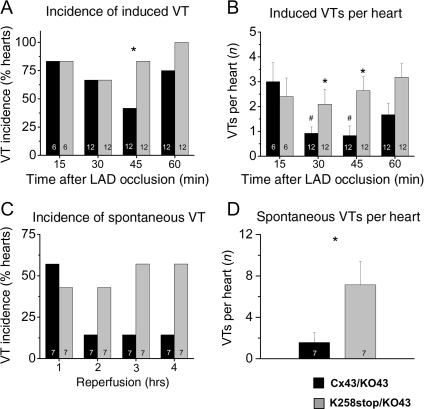
Ventricular tachycardia susceptibility. (A) Percentage of hearts susceptible to burst-pacing-induced tachyarrhythmias at each time point for Cx43/KO (black columns) and K258stop/KO (grey columns). K258stop-expressing hearts displayed higher inducibility of pacing-induced tachyarrhythmias at 45 min (83.3 vs. 41.6% in WT) and 1 h of LAD occlusion (100 vs. 77.6%). (B) K258stop/KO hearts (grey columns) showed higher number of VT episodes compared with Cx43/KO controls (black columns) at 30 and 45 min of ischaemia. (C) Percentage of hearts displaying spontaneous VTs during each hour of reperfusion. Cx43/KO, black bars; K258stop/KO, grey bars. K258stop-expressing hearts displayed trend towards higher incidence of tachyarrhythmias during second (42.9 vs. 14.3% in control), third (57.1 vs. 14.3%), and fourth hours of reperfusion (57.1 vs. 14.3%). Because of small sample size, difference was not statistically significant (Fisher's exact test). (D) K258stop/KO hearts (grey columns) presented with significantly more episodes of tachyarrhythmias than controls (black columns). To assess this variable, spontaneous VT episodes during the entire reperfusion were counted for each animal and averaged per genotype (1.57 ± 0.95 in Cx43/KO hearts vs. 7.14 ± 2.27 in K258stop/KO hearts; P = 0.043).

