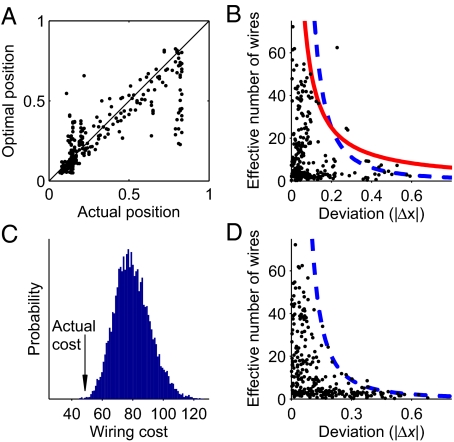
Fig. 2.
Deviations of soma positions in C. elegans from the optimal positions of minimum wiring configuration. (A) Position of somas obtained by deterministic wiring cost minimization versus experimental values. Perfect match between deterministic optimization theory and experiment would fall on the diagonal. (B) Effective number of wires of each neuron (ω) versus experimental deviations from optimality (|Δx| ≡ |xexperimental−xopt|). Larger deviations are expected for neurons with lower ω. Blue dashed line follows ω ∝ |Δx|−2, and red solid line follows ω ∝ 1/|Δx|−1. The three outliers (above the red line) are neurons DA6, AVAL, and AVAR. (C) Histogram of the wiring costs resulting from random redistribution of the deviations of somatic positions from their optima. Arrow indicates the cost of the actual configuration. Only 0.033% of the permutations have a lower cost. (D) Effective number of wires (ω) versus deviations obtained from a simulation performed by stochastic hill climbing with a Gaussian stochastic component added to wiring cost. Blue dashed line corresponds to the approximate theoretical prediction, ω ∝ |Δx|−2.

