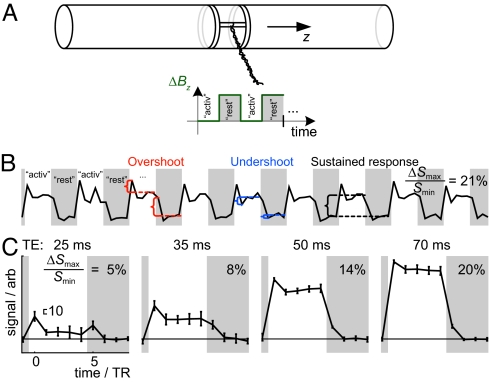
Fig. 1.
Set-up and fMRI time course of the gradient phantom. (A) An optical control signal was transformed into magnetic field by modulating Bz using a pair of coils. Mimicking fMRI activations, the times when the field is most homogeneous, i.e., additional Bz is off, is labeled activation. The gray areas denote the rest condition (i.e., additional Bz is turned on). (B) Mean signal from a 12-voxel ROI shows overshoots and undershoots between the sustained responses, after the changes of Bz. (C) Mean ± SD signal (n = 9) from the ROI as a function of TE. TR = 2,000 ms. The maximum range of the signal variation (ΔSmax) in relation to the lowest signal level at rest (Smin) are provided (B and C) along with a scale bar indicating an equal signal change (10) in arbitrary signal units in each plot (C). The rest and activation conditions both lasted 5 TRs, i.e., 10 s.

