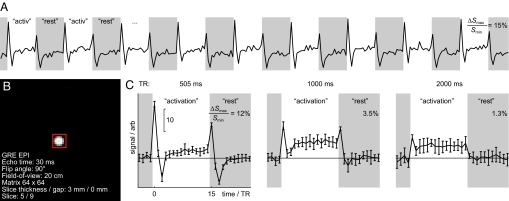
Fig. 2.
Transient signal components from the uniform phantom. (A) Mean signal from an ROI as a function of time. (B) The transverse section of the phantom, showing the 49-voxel ROI (red box); the imaging particulars are indicated. (C) The plots show the mean ± SD signal (n = 9) from the ROI. For all three TRs, step changes of Bz produced periods of transient deflections, the amplitudes of which decreased as TR was increased. Percentage signal changes and scale bars are as in Fig. 1. Each block of activation or rest lasted 15 TRs, i.e., 7.5, 15, or 30 s at TRs of 500 ms, 1 s, and 2 s, respectively.

